Dashboard
The Dashboard section provides financial metrics summarizing the bookmaker's trading activity. The data is updated every 4-5 hours.
Each metric has a separate interface block. Each block has a Last update field indicating the time by which it was calculated.
Today stake sum
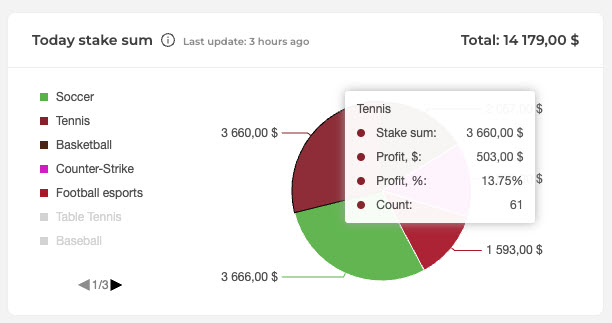
The Today stake sum pie chart displays the sum of all today's stakes by sports. You may disable specific sports by clicking on the sport name in the legend (left side of the chart). Total is the sum of all stakes representing today's money turnover. Disabling a sport will not affect the Total value.
By default, the diagram shows the distribution of stakes between the top 5 sports. When a cursor is pointed at the sector of a certain sport, a pop-up with the following parameters opens more detailed stats:
- Bets, $ – shows the total sum of bets on the selected sport.
- Profit, $ – shows the total amount of your profit from bets on the selected sport.
- Profit, % – the percentage of the profit amount from bets on the selected sport from the total profit for the current day.
- Count – number of bets on the selected sport.
Bet counts
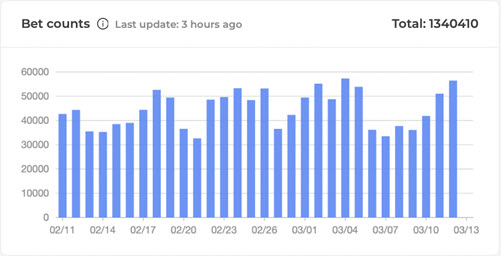
The Bet counts histogram displays the number of bets for each of the last 30 days, excluding the current one. Total is the number of bets over the last 30 days. The horizontal axis shows the date, and the vertical axis shows the number of bets for each day.
Profit
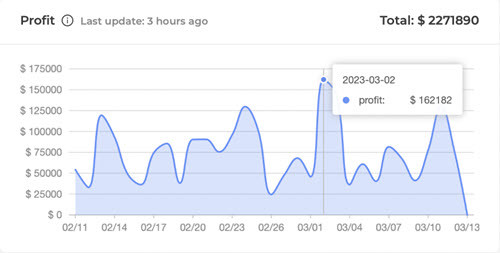
The Profit graph shows the profit value per day over the last 30 days. Total is the amount of profit over the last 30 days, excluding the current day. The horizontal axis shows the date, and the vertical axis shows the profit value.
Daily stake sum
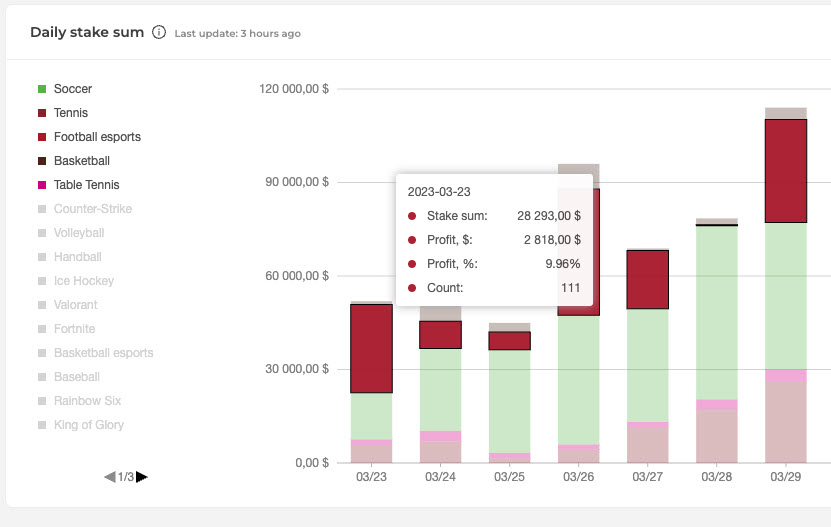
The Daily stake sum bar chart shows a sport-based money turnover per day. Total is the sum of all bets over the last 30 days, excluding the current day.
The column on the left lists all sports on which bets are accepted. If a sport is active (not grayed), its data is displayed in the chart. An inactive sport can be activated and added to the chart by a click on it. To display the sum of bets within the selected sport, hover over the sport name and click the round icon to the right of the sport name ![]() . The horizontal axis shows the date, and the vertical axis shows a sport-based amount of profit.
. The horizontal axis shows the date, and the vertical axis shows a sport-based amount of profit.
By default, the chart shows the distribution of stakes between the top 5 sports. When a cursor is pointed at a sector of a certain sport and day, a pop-up opens with the following properties:
- Bets, $ – shows the total sum of bets on the selected sport.
- Profit, $ – shows the total amount of your profit from bets on the selected sport.
- Profit, % – shows the percentage of the profit amount from bets on the selected sport from the total profit for the current day.
- Count – shows the number of bets on the selected sport.


